Using Agentic Coding Tools for Crime Analysis
In my book, Large Language Models for Mortals: A Practical Guide for Analysts, I have an example of editing my crimepy library using Claude Code.
The agentic coding tools are all really exchangeable in my experience. I have been using Claude Code for over a year (since Sonnet 3.7), but have more recently been experimenting with the Gemini (Google’s models) and Codex (OpenAI’s tool) the same. Here I wanted to show a recent session I had using Gemini CLI to conduct crime analysis of thefts from motor vehicles in Chapel Hill.
You can see the entire output of the conversation, as well as each of the individual files created, in this github commit.
Note this is a plain vanilla session of the Gemini CLI (version 0.36.0). I do not have anything additional in my workspace like a GEMINI.md, MCPs, memory files, or skills files that Gemini would use (I have skills in the repo, but for Claude Code, not Gemini).
I use the gemini cli through Vertex and my google cloud account. This by default has zero permanent data retention and is only routed to models in the US.
What does crime analysis look like with these tools?
I saved my exact conversation with gemini, but it is short enough to just save right in this blog post to show a typical workflow. In total to produce a final report I went through 9 prompts. Here is prompt #1.
INPUT 1: line 103

Review the functions in the repo, specifically in the /crimepy folder the query.py, chain.py, and geo.py functions. I am going to have you write a python script to analyze car break ins in Chapel Hill.

For some details

 - Chapel hill crime data API endpoint, https://services2.arcgis.com/7KRXAKALbBGlCW77/arcgis/rest/services/Recoded_Incidents_New/FeatureServer/0/query
 - Chapel Hill Boundary of city, https://gis-portal.townofchapelhill.org/server/rest/services/OpenData/UrbanServiceBoundary/MapServer/0/query
 - local proj, 'EPSG:2264'

 - Create script to download crime data one year at a time, going back to 2020
 - filter out car break ins
 - create a monthly chart of the break-ins over time
 - run the functions in chain.py to identify clusters of thefts within 1000 feet and 7 days of each other
From a different project, I had the url for the Chapel Hill crime data already available and the local projection I wanted to use. Very impressively, after this first prompt, the Gemini cli created a series of scripts to get the data from Chapel Hill, identify the necessary fields to be able to pull out burglaries from motor vehicles (the public Chapel Hill data just has a plain text field, not NIBRS codes), limit the ESRI queries to only vehicle crimes, and then subsequently produce the correct report.
The models have gotten incredibly good at long term planning (across all model providers). There is quite a bit of buzz about skills recently for these CLI tools – I barely even use them. Just giving the model instructions is sufficient for them to do quite complicated tasks.
I did not save the initial PNG this produced, but asked Gemini to create another using my Crime De-Decoder theme and functions with error bands. Already when this was working, I hit Ctrl+C to stop the output, and amended my prompt to also say cache the resulting queries of the crime data.
INPUT 2: line 1043
take the function out of main.py, later on I am going to change this to a jupyter notebook example
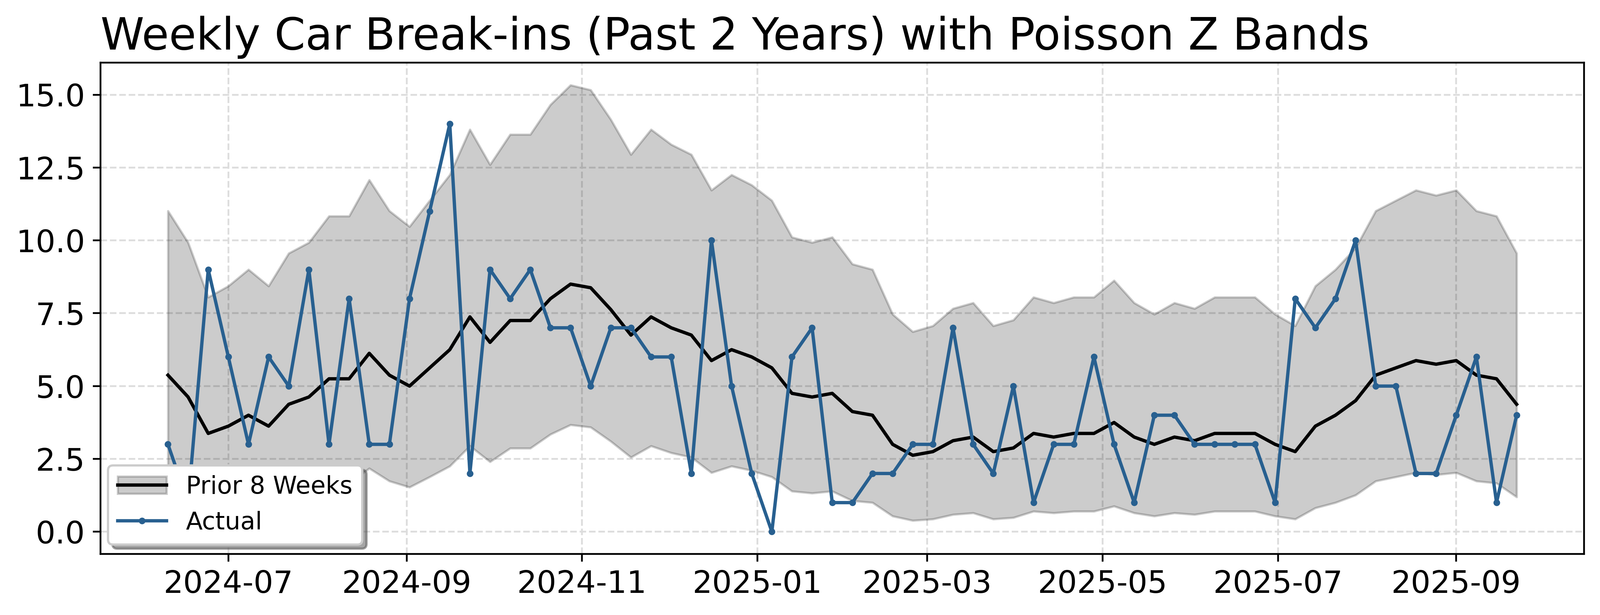
from crimepy import cdcplot, use the functions in there plus the time.py file to create the monthly chart, and then make a seperate weekly chart for the past two years with the Poisson Z bands
------------
I then hit ctrl-c to stop the prior command and add this statement
INPUT 3: line 1099
For the downloading Chapel Hill data, make it cached, so if CSV file on crimes exists, load that in, if not, download the dataThis dutifully did what I asked, and even used my internal function query.cache_query to cache the file.
def get_data(cache_file=CACHE_FILE):
    """Gets data from cache or downloads it."""
    df = cache_query(cache_file, fetch_chapel_hill_crimes, {'start_year': START_YEAR})

    if not isinstance(df, gpd.GeoDataFrame):
        # Convert to GeoDataFrame using the Latitude/Longitude fields
        df = gpd.GeoDataFrame(df, geometry=gpd.points_from_xy(df.Longitude, df.Latitude), crs='EPSG:4326')

    return df
Here is the chart of crimes week over week in Chapel Hill (unfortunately they do not keep their ESRI data very up to date, it is months behind at this point)
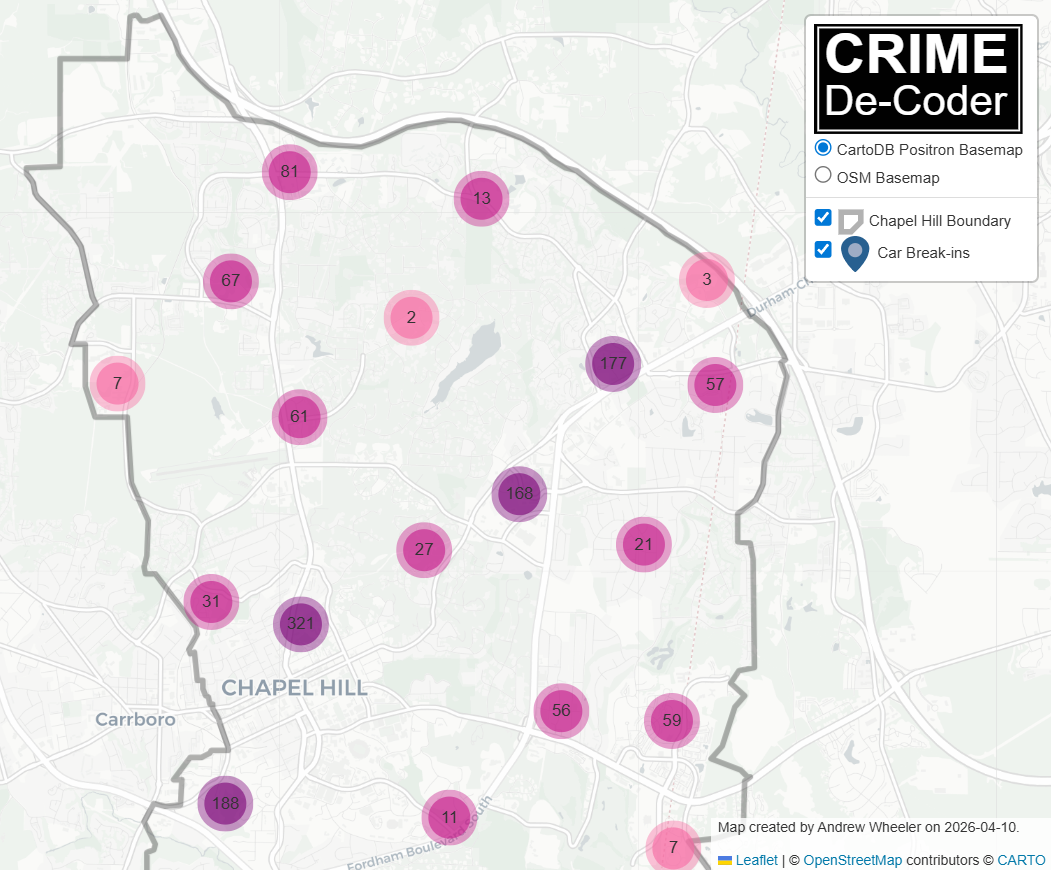
For the final steps, I noticed the code was using a too loose of definition to filter out burglary of motor vehicles. Then I asked it to create a folium map, and had a few additional iterations. (While gemini can execute the python code and see errors, this session I did not set it up to be able to actually interact with the resulting HTML, I do have an example of that though in the LLMs for Mortals book using Google’s Antigravity tool).
------------
INPUT 4: line 1170
In the filter, don't use B&E and 'BREAK-IN', the other two look ok though. So will need to delete the data and regenerate
Now also make a folium map with the outline and clustered points for the breakin. For the popup, have the date and time of the event.
-------------
INPUT 5: line 1286
Include in the popup the incident ID, the NIBRS Code field, and the street. Make the pop up formatted a bit nicer
INPUT 6: line 1377
I manually ran
!python chapel_hill_analysis.py
INPUT 7: line 1419
I accidentally did a prompt while still in shell mode,
INPUT 8: line 1434
The popup window is too small, do I have an argument to increase its size? If not, create one
INPUT 9:
Instead of the reported as field, use the Offense field in the popup description
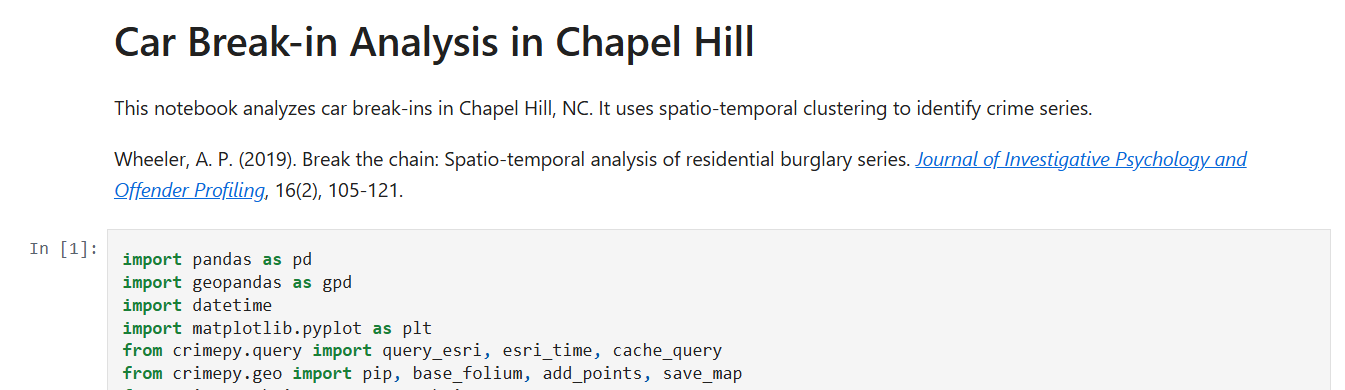
now create this as a jupyter notebook, check out the DBScanHotspots.ipynb example, make this similar in format. An entry markdown slide, citing my break the chain paper, then a cell to download the data, then a cell to make the time series charts, then a cell to get the clusters and print out the latest clusterThis session cost a total of $0.44 (I use the pay as you go API). I did not save the exact time it took, but I believe my total time I spent on this was easily less than 30 minutes total (I simply forgot to export the chat before doing other things, it definitely was not 1.5 hours).
│                                                                                                                                     │
│  Interaction Summary                                                                                                                │
│  Session ID:                 3263b796-be81-45d0-9d47-bedcb6925fc0                                                                   │
│  Tool Calls:                 46 ( ✓ 46 x 0 )                                                                                        │
│  Success Rate:               100.0%                                                                                                 │
│  User Agreement:             100.0% (46 reviewed)                                                                                   │
│  Code Changes:               +558 -71                                                                                               │
│                                                                                                                                     │
│  Performance                                                                                                                        │
│  Wall Time:                  1h 35m 46s                                                                                             │
│  Agent Active:               7m 12s                                                                                                 │
│    » API Time:               4m 37s (64.0%)                                                                                         │
│    » Tool Time:              2m 35s (36.0%)                                                                                         │
│                                                                                                                                     │
│  Model                   Reqs   Input Tokens   Cache Reads  Output Tokens                                                           │
│  ────────────────────────────────────────────────────────────────────────                                                           │
│  gemini-2.5-flash-lite      7         31,837             0            433                                                           │
│  gemini-3-flash-preview    44        375,092     2,864,115         15,594                                                           │
│  gemini-3.1-pro-preview     6        107,346       350,743          2,426                                                           │
│                                                                                                                                     │
│  Savings Highlight: 3,214,858 (86.2%) of input tokens were served from the cache, reducing costs.
You can go see the final Jupyter notebook report the gemini cli made on github to see the outputs (minus the folium map is not rendered on github).
What errors did the tool make?
My workflow with these agentic coding tools has become one of trust but verify – I almost always accept changes, but then review the code and then ask for additional updates. In the original workflow, I only identified one error when reviewing the code, and then asked Gemini to correct it (filtering claims based on the plain text search of ‘LARCENY’ and ‘B&E’). In practice, a crime analyst would typically not filter by strings, but by specific NIBRS codes. The Chapel Hill open data however do not contain NIBRS codes.
When reviewing the final Jupyter notebook that was created, there were a few additional errors.
Only one of those errors I would consider a major error – in the markdown for the initial report, it created a hallucinated citation. This is a portmanteau of several of my papers together (a common hallucination pattern for citations I have seen other AI models generate).
The other errors are very pedantic:
- import matplotlib but did not need it
- folium map is not quite equivalent (when saving the physical html file, adds in legend and sets the basemap differently)
The code I would consider mildly verbose at a few times (and has lines that are too long and should be split). These are more about taste though – the code is not technically wrong.
Each of these errors, when reviewing, takes just a few seconds to correct. But that review stage is still necessary.
One of the reasons I prefer the workflow of a human in the loop is that I often do not have 100% of the requirements up front. I change my mind mid-stream, add in additional things, etc. So even if the agent harness was sufficient to run without a human in the loop, the end result would look different than what I produce when working together with the agentic coding tool.
One piece of the code that was not an error, but I imagine it could have easily happened, when I asked to do space-time clusters within 7 days and 1000 feet, I am not sure if Gemini really knew the local projection EPSG:2264 was actually in feet. (It is possible the model was trained with the data to know it indeed is in feet.) So it default passed in the parameters to the function of 1000, but if the local projection were actually in meters and not feet, this could have been an error.
What this means for analysts?
I was recently on Jason Elder’s Law Enforcement Analysts Podcast, and talked a bit about the long term trajectory for what crime analysis will look. Many people look at the AI tools and think it will take jobs. I do not think this is the case. If you can write code to mostly automate the 10 things you do in the day as an analyst, this does not mean you have no more work. It just means you now how time to go and do 10 additional things. There is no real upper bound on the demand for analysis.
It will however become increasingly more important for analysts (not just crime analysts, but analysts in general) to leverage these tools to do their jobs more efficiently. If you do not, you will be left in the dust in the foreseeable future.
Learning how to write python code with the advent of the AI coding tools is becoming more important, not less. As you can see in the above example, the simple “cite the correct paper” was wrong from the tool, but the code was basically entirely correct. Coding is easier for the models to figure out, because it provides immediate feedback. The coding tools can write a python script (or a shell script), execute it, and see the results.
It takes basically zero set up to do this effectively on your desktop. Criminal justice agencies simply need to provide access to appropriate models (for AWS users, you can set up Claude Code, for Azure can set up OpenAI, and for Google can use Gemini like I did here). The typical set up for these tools are zero long term data retention, and are sufficient for even law enforcement sensitive data. After that all you need is an API key to get started.
For those analysts interested in getting started, check out my store for entry level texts on python as well as agentic coding tools. If you are a leader of a criminal justice organization and would like help training up your analysts in these tools, or rolling out these tools safely for your organization, do not hesitate to get in touch to see if I can help.