Demonstrations
Live web demonstrations that CRIME De-Coder can build for your agency.
Crime Trends Dashboard
Fully automated dashboard with up to date Dallas crime trends. Tech stack: serverless dashboard using pyscript and automated daily refresh using github actions.
WDD Crime Reduction Tool
A html and javascript application to apply a statistical test CRIME De-Coder developed to estimate how many crimes were reduced in a place based intervention.

Interactive Hot Spot Map
Customized, interactive mapping applications. Tech stack: leaflet and python/folium to create customized looks and interactions.

Have an idea for an application? CRIME De-Coder has a wide array of experience in statistical programming (python, R, Stata, SPSS), data engineering (SQL, Postgres, spark), and additional data science tools (docker, javascript, php, github). I can help you make your app come to life.
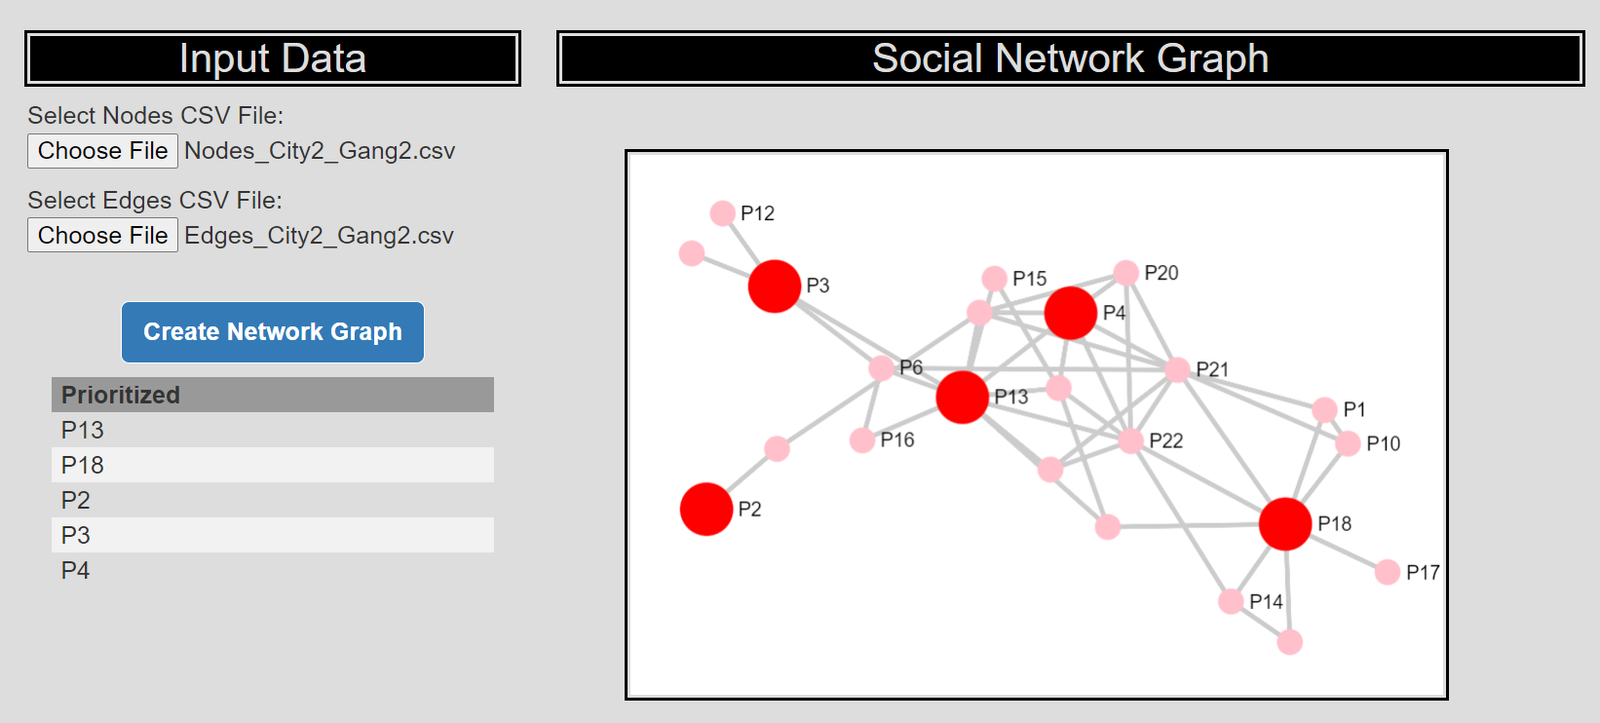
Network Prioritization Tool
Upload your own network and apply algorithm to prioritize gang call-ins. Tech stack: interactive javascript application using sigma.js.
Custom Survey
Demonstration of how CRIME De-Coder can implement customized surveys. Tech stack: PHP with google sheets backend.

Sworn Dashboard
Dashboard to compare policing hiring statistics to other agencies in the US (based on data from the FBI). Tech stack: Supabase and SQL functions to generate statistics, and D3.js

Example Static Report
Sometimes all you want is a static report. This auto-report is created and refreshed once a week using python, Quarto, and word (and hosted on web as PDF).
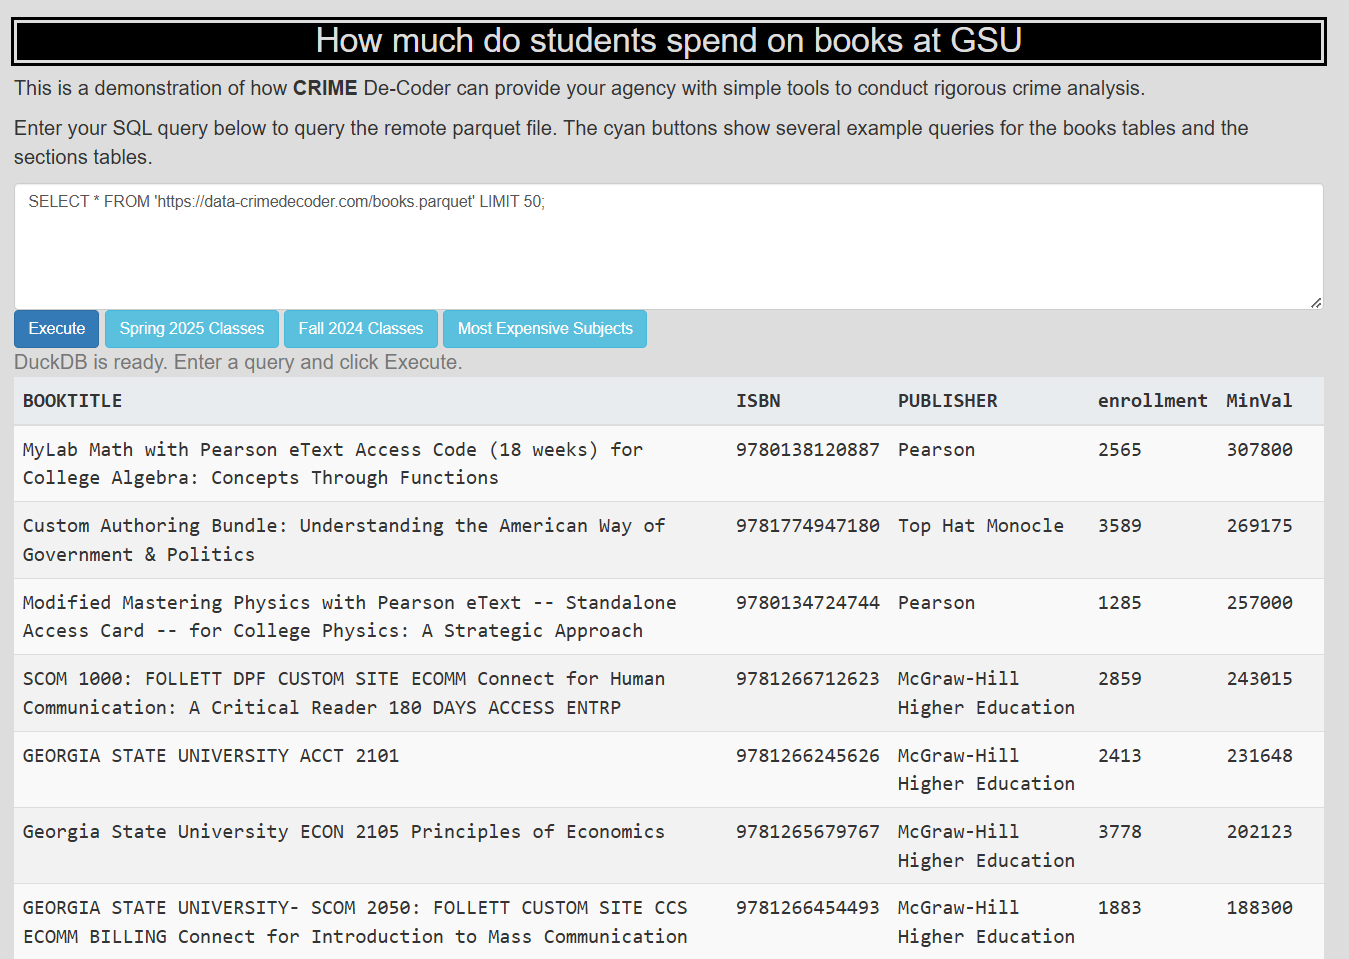
GSU Book Prices Tables
Dashboard showing how to conduct ad-hoc queries. Uses Cloudflare R2 to host the data, DuckDB WASM to form ad-hoc SQL queries, and D3.js to create a sortable table.
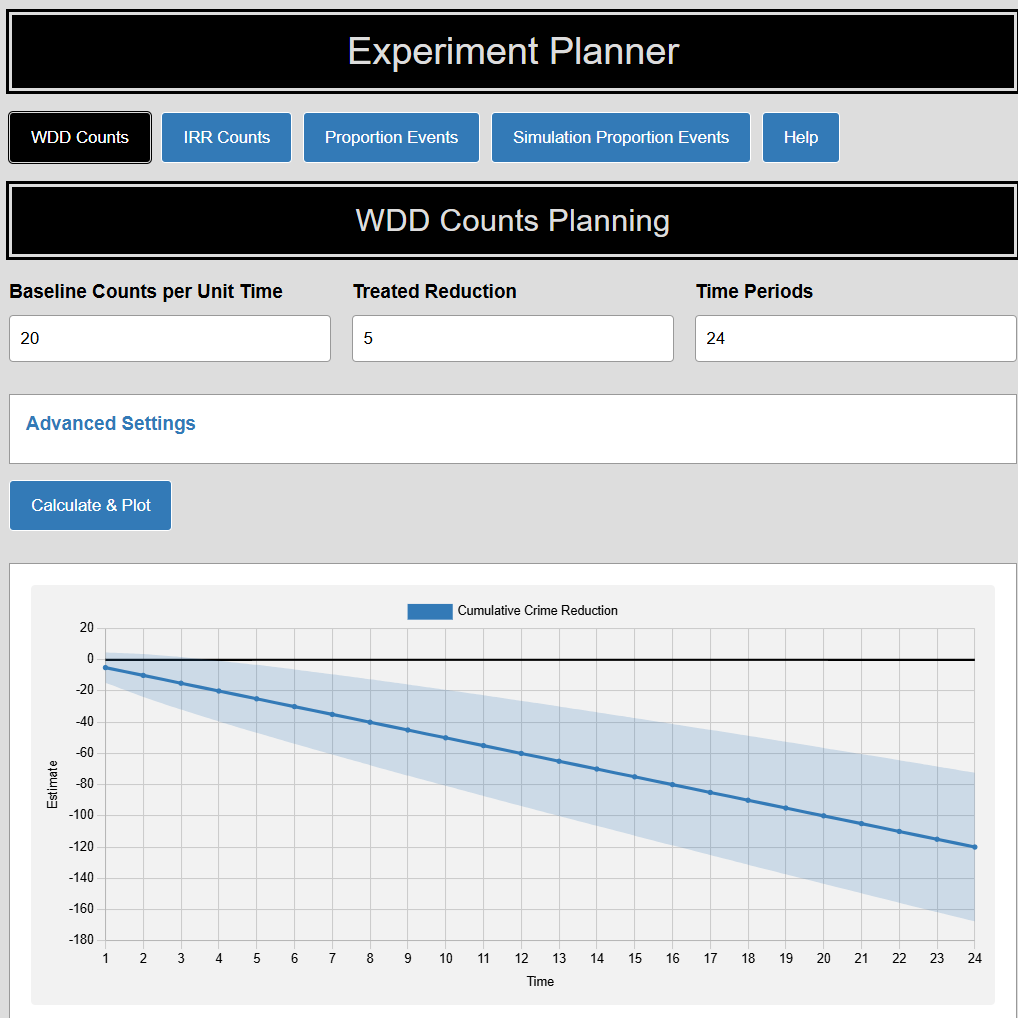
Experiment Planning Tool
Interactive tool to plan crime reduction experiments and estimate necessary sample sizes. Tech stack: WebR to run R simulations directly in the browser.
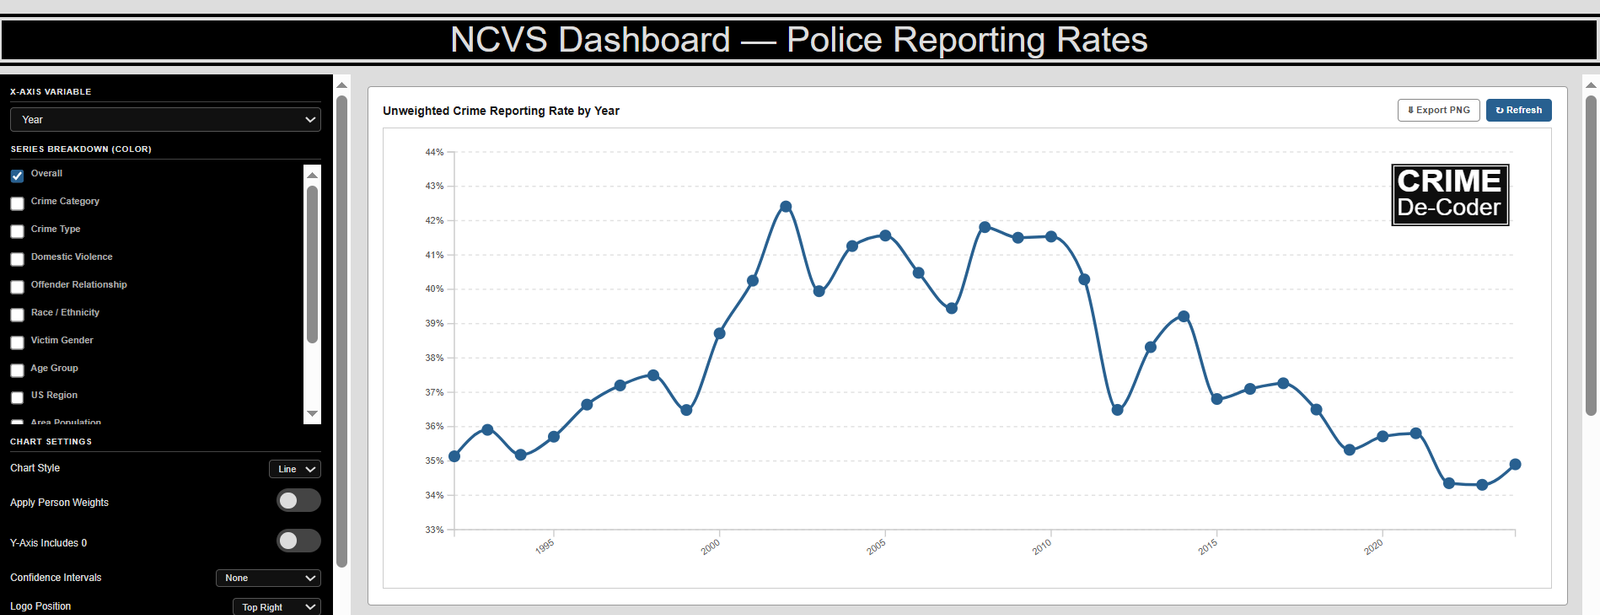
NCVS Crime Victimization Dashboard
Interactive analysis of victimization reporting rates to police in the United States (NCVS 1992-2024). Tech stack: Cloudflare R2 to host the data, DuckDB WASM to form ad-hoc SQL queries, and D3.js for interactive visualizations.