A Primer on SNA for Crime Analysts
Social Network Analysis (SNA) is a way of describing the relationship between entities. Don’t let the name fool you – it is not just analyzing Facebook posts. One of the most common use cases for SNA in crime analysis is the analysis of gang networks. Below is an example gang network, where circles are different gang members, and lines show connections between those members (actual names are replaced with P1, P2, etc.):

Another common name for a network graph in crime analysis is a link chart.
Where does SNA data come from?
To create a network you need two pieces of data – nodes and edges. Nodes represent different entities – most of the time in crime analysis nodes represent people, but they can represent other entities as well. For example, nodes can be people, places, vehicles, phone numbers, etc.
Edges are then drawn between two nodes that are linked together. So two people can be linked by being known associates, a person can be linked to a vehicle by having a traffic stop in that vehicle, two different people can be linked to the same address by listing a home address, two individuals can be linked by one victimizing the other, etc.
Data to fill in a SNA graph can come from multiple sources – including administrative records data and local intelligence data. For example, to identify individuals who belong to a gang is often intelligence driven by a specialized gang officer. They typically use street intelligence (talking to people, or specific observed behavior) to associate an individual with a known street gang.
Not everyone associated with a gang knows each other though, and so to identify edges between those members, crime analysts often rely on administrative data. Edges in the above particular graph are calculated based on co-arrests (being arrested at the same incident) or co-stopped (in either a pedestrian or traffic stop). Gang networks most often are not hierarchical (like an organization chart), but have complicated connections and sub-groups.
Another example that can link people are common associations between places – e.g. two individuals are known to deal drugs in the same parking lot.
What type of analysis can you do with SNA data?
Just drawing a network graph is often illuminating for people investigating groups – but there is more advanced data analysis that crime analysts can do with social network data.
One is identifying network patterns that deserve further scrutiny. Tamara Herold’s Place Based Investigations identify small, concentrated networks of people and places that overlap. Similar to hotspots of crime, there can be a concentration of connected people that all are chronic, problem offenders.
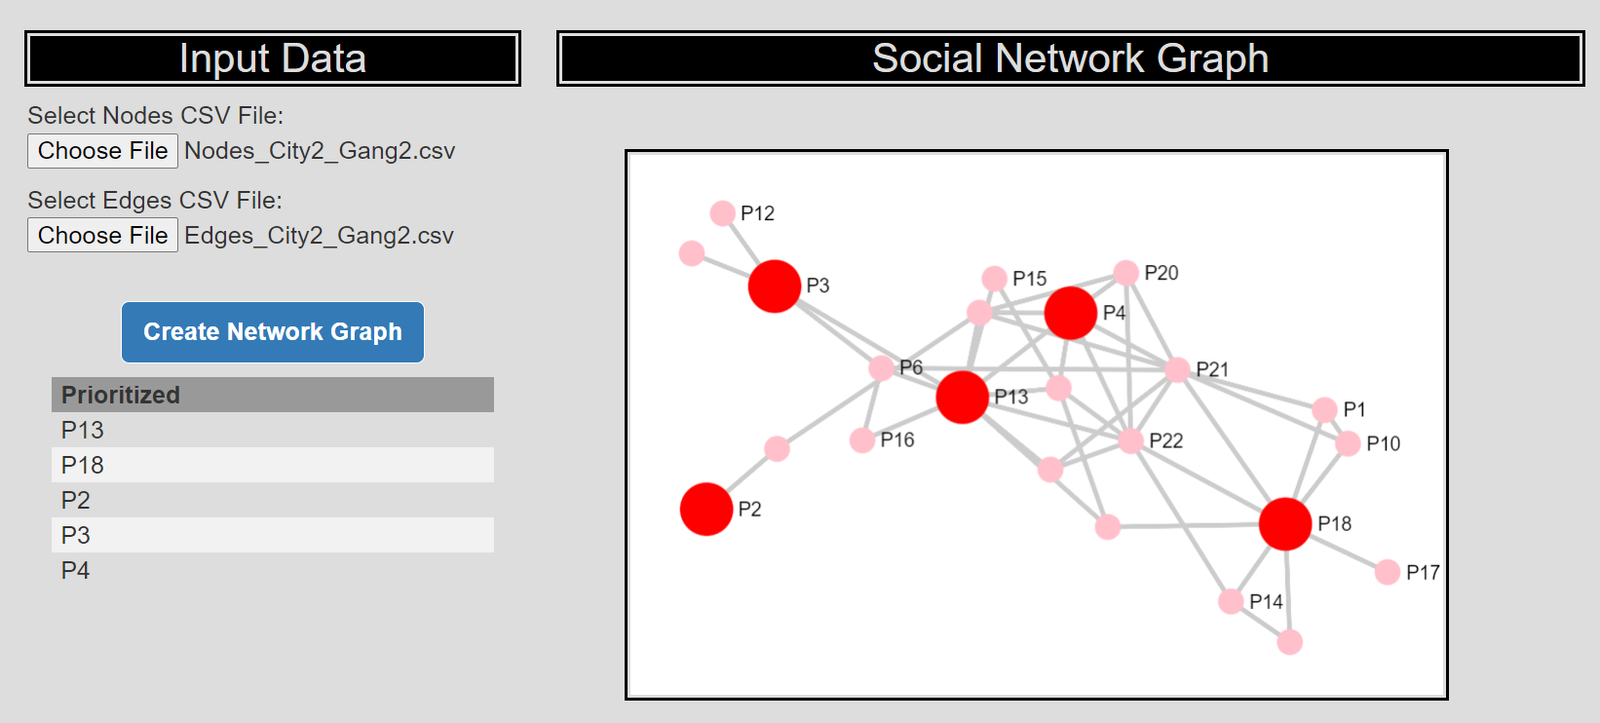
Another example is the focused deterrence group violence intervention. This intervention delivers a deterrence message to an entire gang at once – if a single person in the gang commits a violent act, law enforcement will rigorously pursue the entire gang. CRIME De-Coder has developed custom algorithms to prioritize individuals to deliver the deterrence message to efficiently maximize the spread of the deterrence message throughout the gang network (screenshot below of the free tool to calculate this metric). Larger red circles are individuals who should be prioritized to spread the message throughout the gang network.
CRIME De-Coder has extensive experience in conducting SNA, helping police departments implement evidence based policing strategies (like focused deterrence) that have been shown to reduce violence, and conducting outcome analyses to show if your intervention is working. Get in touch with CRIME De-Coder if you are interested in applying SNA to your agencies data.
References
Braga, A. A. (2016). The continued importance of measuring potentially harmful impacts of crime prevention programs: The academy of experimental criminology 2014 Joan McCord lecture. Journal of Experimental Criminology, 12, 1-20.
Braga, A. A., Weisburd, D., & Turchan, B. (2018). Focused deterrence strategies and crime control: An updated systematic review and meta‐analysis of the empirical evidence. Criminology & Public Policy, 17(1), 205-250.
Eck, J. E., Linning, S. J., & Herold, T. D. (2023). The Extended Place Manager II: Hidden Crime-Involved Places and Place Networks. In Place Management and Crime: Ownership and Property Rights as a Source of Social Control (pp. 67-77). Springer.
Wheeler, A. P., McLean, S. J., Becker, K. J., & Worden, R. E. (2019). Choosing representatives to deliver the message in a group violence intervention. Justice Evaluation Journal, 2(2), 93-117.